Project Management & Executive Dashboards

Drive better decisions, align teams, and track success in real-time with customized project management frameworks and interactive dashboards tailored to your business goals.

Streamline Workflows and Visualize Success

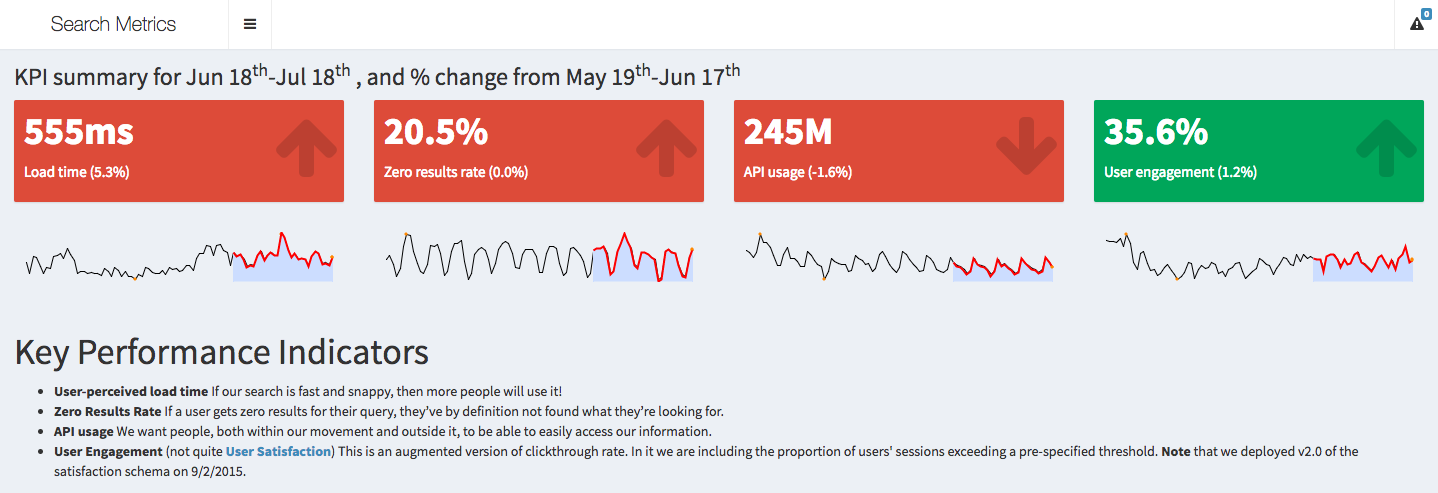
BMG Capital empowers organizations to streamline project workflows, monitor key performance indicators (KPIs), and visualize actionable insights across departments. Our customized solutions drive better decisions, align teams, and track success in real-time.

Core Offerings

Custom Dashboard Development

  • Interactive dashboards built in Power BI, Tableau, or other softwares
  • Integrations with project tracking tools
  • Real-time metrics on project timelines, budgets, and team performance

Project Workflow Automation

  • Automate status reporting and milestone tracking
  • Connect tools like Trello, Jira, and Smartsheet to central dashboards
  • Build alerts, reminders, and escalations
  • Build API and ETL pipelines to ensure that your data is properly stored in your cloud or any other storage unit

Executive & Stakeholder Reporting

  • High-level summaries with drill-down capability
  • Export-ready reports for board meetings, grant funders, and investors
  • Custom visualizations aligned to KPIs and strategic initiatives

Data Integration & Governance

  • Consolidate fragmented data sources across teams and systems
  • Apply role-based access and audit trails
  • Ensure security and consistency with metadata tagging and ETL pipelines

Why BMG Capital?

End-to-End Delivery

From needs assessment and wireframes to deployment and team onboarding, we handle every aspect of your project management solution.

Platform Agnostic

We build for Power BI, Tableau, Looker, and open-source tools - whatever works best for your organization.

Proven Expertise

Dashboards deployed for university health systems, engineering firms, and public-sector programs with measurable results.

Gantt View Dashboard

Visualize project stages, dependents, and blockers to confront progress with schedule.

Gantt Chart Example
Executive Dashboard KPIs

For Executives

See portfolio performance across departments

Track initiative progress by area of risk

Monitor team bandwidth and resource constraints

RAG Status Trackers

Monitor project health with easy-to-read red, amber, and green status updates.

RAG Status Dashboard
KPI Marketing Dashboard

KPI Drilldowns

Get detailed insights into project KPIs by phase, project owner, and risk level.

Optional Add-Ons

KPI Library Design

Comprehensive KPI library design and documentation tailored to your business objectives and industry standards.

System Selection & Configuration

Project management system selection and configuration support to ensure optimal tool alignment with your workflows.

Monthly Analytics Reporting

Ongoing monthly analytics reporting service to keep stakeholders informed and projects on track.

Ready to Visualize Your Progress and Manage Projects with Clarity?

Contact us for a dashboard strategy session and discover how our project management solutions can drive efficiency and alignment for your organization.

Combine our project management dashboards with our data analytics solutions for comprehensive business intelligence and strategic oversight.

Schedule Strategy Session

contact@capitalbmg.com | (720) 610-5871